
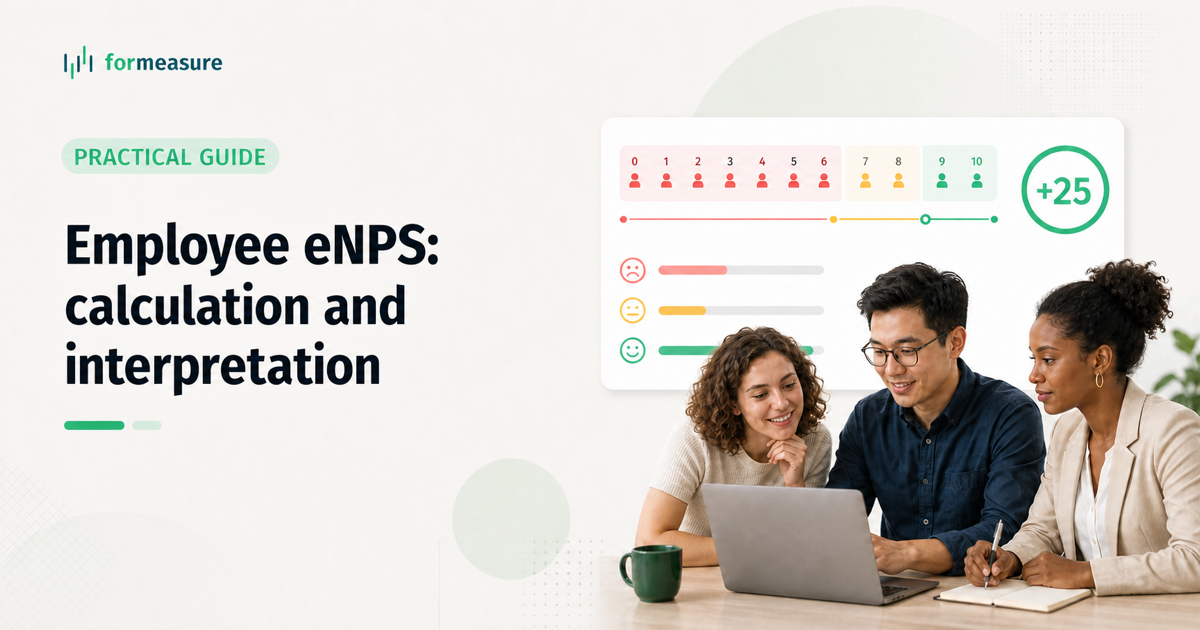
Imagine a company with 100 employees. Forty-five would recommend it as a place to work, 35 sit in the middle, and 20 are unlikely to recommend it. Its eNPS is +25.
The arithmetic takes less than a minute. The useful questions come next. Is +25 actually good? Why would one in five employees hesitate to recommend the company? Is the picture consistent across teams? And how much should anyone infer from a single number? That is where a sensible eNPS analysis begins.
What employee eNPS measures
eNPS stands for employee Net Promoter Score. It measures an employee’s willingness to recommend their company to someone else as a place to work. It is also described as an employee loyalty score, a convenient shorthand that is broader than the question itself. eNPS measures willingness to recommend an employer; it does not measure every aspect of loyalty.
The method borrows the mechanics of customer Net Promoter Score: respondents use a 0–10 scale, and the final score is the percentage of promoters minus the percentage of detractors.[1] A high eNPS does not automatically mean employees are engaged, happy with every part of the job, or planning to stay indefinitely. Those are related signals, not interchangeable ones.
The eNPS question and scale
The standard question is straightforward. Keep the wording focused on recommending the employer:
How likely are you to recommend our company to a friend or colleague as a good place to work?
0 — Not at all likely
10 — Extremely likely
The 11-point scale and three response groups follow the established NPS method. If you want a reliable trend, keep the wording, scale, audience, and survey method consistent from one cycle to the next. Even a small change can make two results less comparable.
How to calculate eNPS
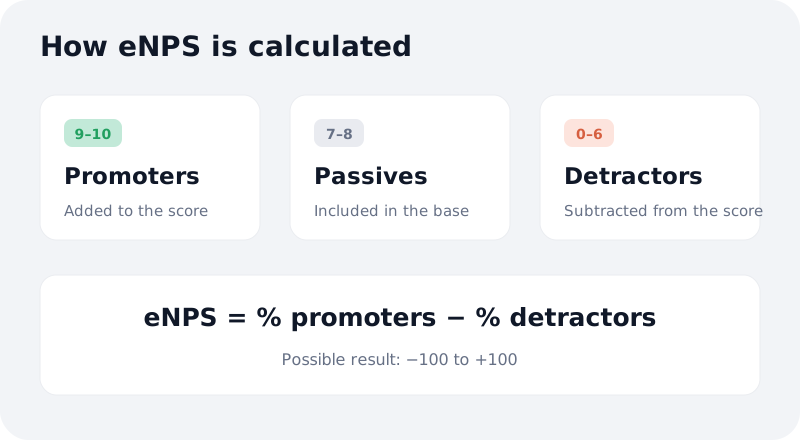
Start by dividing responses into three groups. Each group has a different role in the calculation:
| Score | Group | What it means | Role in eNPS |
|---|---|---|---|
| 9–10 | Promoters | Highly likely to recommend the company | Added as the promoter percentage |
| 7–8 | Passives | Neither strong advocates nor active detractors | Included in the response base but not added or subtracted |
| 0–6 | Detractors | Unlikely to recommend the company | Subtracted as the detractor percentage |
Then apply the formula:
eNPS = % of promoters − % of detractors
Passives are not subtracted, but they still count toward the total number of responses used to calculate both percentages.[1] Using the 100-person example, the response groups are:
- 45 employees answered 9 or 10;
- 35 answered 7 or 8;
- 20 answered between 0 and 6.
With those counts, calculate the two percentages and subtract:
- Promoters = 45 / 100 × 100% = 45%
- Detractors = 20 / 100 × 100% = 20%
- eNPS = 45% − 20% = +25
The possible range is −100, when every respondent is a detractor, to +100, when every respondent is a promoter. Any result outside that range signals a calculation error.
Is an eNPS of +25 good?
There is no universal line that turns an eNPS into “good” or “bad.” Plenty of benchmark tables assign labels to score ranges, but they do not all use the same cutoffs. Results also vary by industry, geography, company size, and survey population. An external benchmark can add context; treating it as a target often creates false precision.[4]
A +25 is more useful when you read it in three ways. First, look at your own trend. A move from +4 to +13 and then +25 tells a very different story from a fall from +42 to +25.
Next, examine differences between teams. A calm-looking company score can hide a team whose experience is sharply worse than everyone else’s. Keep the full response distribution and comments in view as well. Two surveys can both return +20: one contains 40% promoters, 40% passives, and 20% detractors, while the other has 60% promoters and 40% detractors, with no passives at all. The headline score is identical, but the organizations do not look identical. Instead of asking only “What is a good eNPS?”, ask: What are we comparing this result with, and what has changed since the last survey?
What useful eNPS analysis looks like
Olivia leads People Operations at a 140-person company. The latest survey returns an overall eNPS of +18, and nothing about that number immediately alarms her. Then she compares teams: one has an eNPS of +45; another sits at −12. This is where the metric becomes useful.
In the second team’s comments, several employees independently mention priorities changing without warning. Others say they wait weeks for feedback from their manager. The +45 team describes something different: room to make decisions and clear working agreements with its manager. None of this is visible in the company-wide +18.
Olivia does not launch a company-wide “raise eNPS” initiative. She reviews workload and task-setting with the manager of the struggling team, agrees on specific changes, and repeats the measurement after those changes have had time to work. The score is no longer a verdict on the company; it is a starting point for investigation.
Add one question that explains the score
Pair the 0–10 rating with at least one open question. Its job is to explain the score, not replace a fuller employee survey:
What was the main reason for your score?
That follow-up is deliberately broad. It gives the employee room to name the issue that mattered to them rather than forcing their experience into a list HR created in advance. Suppose eNPS falls from +27 to +11: the formula tells you that the balance of promoters and detractors changed, but not whether the cause was a new manager, workload, pay, a reorganization, limited growth, or something else entirely. The comment will not prove causation either, but repeated themes give you a far better place to investigate.
eNPS is not the same as employee engagement
The two metrics appear together in many People reports, but they answer different questions. eNPS asks: Would this person recommend the employer? Employee engagement covers someone’s relationship with their work and workplace more broadly. Gallup defines engagement in terms of employees’ involvement and enthusiasm.[2] CIPD treats it as a psychological state and distinguishes it from related concepts such as motivation, organizational commitment, and identification.[3]
An employee can speak highly of the company yet feel bored in their current role or see no route to develop. The reverse also happens: someone loves the work itself but hesitates to recommend the employer because of pay, management, or instability. If you need to understand both engagement and the workplace conditions around it, use our 17-question employee engagement survey template. One metric can point you in a direction; the explanation sits beside it.
What to do after an eNPS survey
Resist the urge to start with “How do we raise the score?” First work out where the current result came from.
- Review the trend across several comparable surveys.
- Look at the proportions of promoters, passives, and detractors, not only eNPS.
- Compare teams or other relevant groups when the sample size and confidentiality rules allow it.
- Read the comments and identify themes that appear repeatedly.
- Test the most plausible causes through a short pulse survey, a team discussion, or another relevant People metric.
- Make a focused change, measure again, and compare the same views.
The same principles apply beyond eNPS. Our guide to what to do after an employee engagement survey explains how to investigate causes, choose a small number of actions, assign owners, and close the feedback loop.
That creates a much more useful narrative than “our eNPS is 18.” You can see when the score moved, where it moved, what employees said at the time, and whether the follow-up had an effect. In formeasure, eNPS can run as a standalone pulse or sit alongside other employee surveys, so teams can track the overall score, response distribution, comments, changes over time, and differences between groups while applying the appropriate anonymity thresholds.
Want to measure eNPS with your team?
In formeasure, you can run an eNPS pulse, compare teams, read comments, and follow the score across survey cycles.
Run an employee survey in formeasure →
A ready-to-use eNPS survey template
A basic eNPS survey needs only two questions:
1. How likely are you to recommend our company to a friend or colleague as a good place to work?
Scale: 0 to 10, where 0 means not at all likely and 10 means extremely likely.
2. What was the main reason for your score?
Question type: open text.
The first response is enough to calculate eNPS, while the second makes the result far easier to understand. For a recurring survey, keep both questions unchanged so each cycle remains comparable.
Frequently asked questions
What is employee eNPS?
Employee eNPS measures how willing employees are to recommend their company as a place to work. Responses use a 0–10 scale and are combined into one score.
How do you calculate eNPS?
Calculate the percentage of respondents who gave a 9 or 10, then the percentage who gave a score from 0 to 6. Subtract the detractor percentage from the promoter percentage: eNPS = % promoters − % detractors.
What is a good eNPS score?
There is no universal good score. External benchmarks vary by industry, region, and sample. Your own trend, the distribution of responses, team-level differences, and employee comments provide better context.
What is the difference between eNPS and employee engagement?
eNPS measures willingness to recommend the employer. Engagement is a broader view of a person’s involvement in and relationship with their work. eNPS can contribute to an engagement program, but it does not replace one.
Sources
- Bain & Company, Measuring Your Net Promoter Score — the 0–10 scale, promoter/passive/detractor groups, and NPS formula.
- Gallup, What Is Employee Engagement? — a practical definition of employee engagement.
- CIPD, Employee Engagement and Motivation — an overview of employee engagement and related concepts.
- Brown, M. I. (2020), Comparing the validity of net promoter and benchmark scoring — a comparison of net promoter and benchmark scoring in employee surveys.